A slow first byte is a symptom. It can come from a redirect, a distant connection, a cache miss, or an application waiting on its database. Adding more origin CPU only helps one of those cases. Start by locating the delay.
Know what the measurement includes
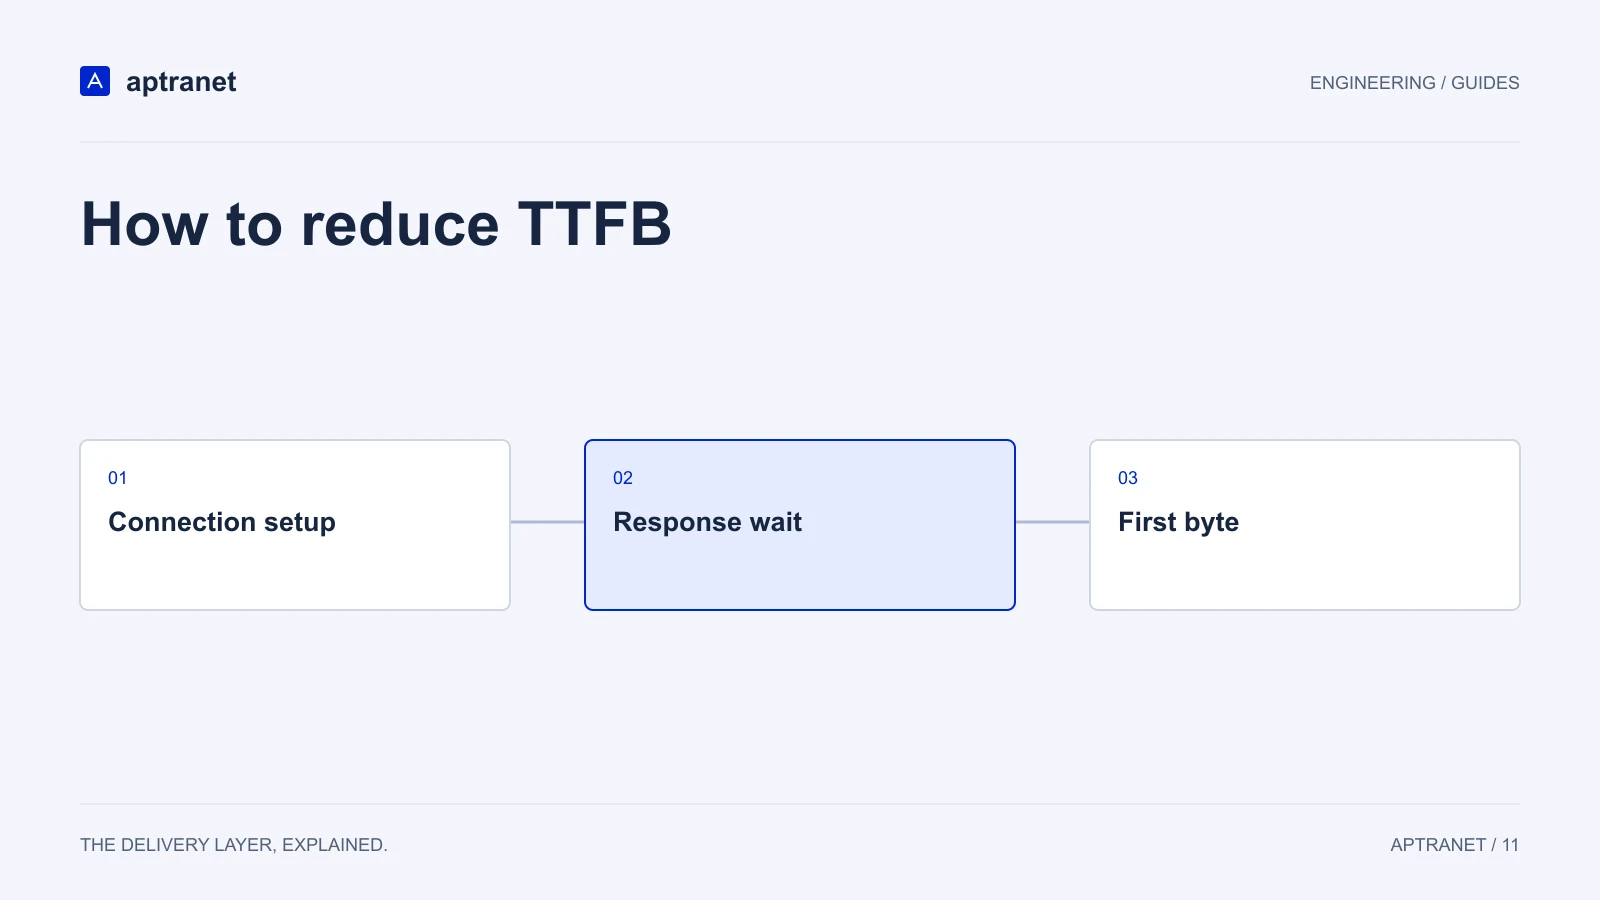
Navigation TTFB measures the time from the start of navigation to the first byte of the response. Depending on the navigation, that includes redirects, DNS lookup, connection setup, and waiting for the server. A backend duration in a trace measures a smaller part of that path.
Read the timing breakdown in your browser test. A reused connection can remove setup costs from one run while a cold connection includes them. Comparing those two results without noting that difference produces an unreliable conclusion.
Use a cache hit to isolate origin work
Request a public cacheable resource repeatedly and inspect its cache status, Age header when available, and origin logs. A confirmed hit should avoid fetching the body from the origin. Compare its timing with a confirmed miss from the same region.
Do not infer a hit from a fast response alone. Cache status header names differ by provider, and an Age header does not describe every layer in a multi-tier cache. Correlate the headers with the configured policy and logs.
curl -sS -D - -o /dev/null https://www.example.com/public-page

# Repeat the request. Inspect Cache-Control, Age, and the
# cache-status headers documented by your CDN provider.
Understand the cost of a miss
A miss may include an edge-to-origin connection, application processing, and transfer back to the edge. A shield can reduce duplicate origin fetches, but the first fetch still has to complete. Improving the application benefits both uncacheable traffic and cache fills.
The following numbers are deliberately hypothetical. They show why the same delivery change can improve a hit more than a miss; they are not Aptranet benchmark results.
Illustrative first-byte budget
Choose a fix that matches the delay
For slow connection setup, remove unnecessary redirects and test the network path from affected regions. For slow origin processing, use traces to find database calls, rendering work, and upstream requests. For frequent misses, review TTLs, key fragmentation, and invalidation behavior.
Caching public HTML can reduce first-byte time when the response is safe to reuse. It is not an appropriate shortcut for account pages, carts, or user-specific API responses. Keep those on a deliberately uncached path.
| Observation | Check next |
|---|---|
| Hits fast; misses slow | Origin timing and edge-to-origin path |
| Hits slow only in one region | Serving location and regional routing |
| Origin trace fast; navigation slow | Redirects, DNS, TLS, and network travel |
| TTFB fast; main content late | Resource discovery, image delivery, and rendering |
Verify that users see the improvement
Repeat the original test with the same device and network profile. Report the region and cache state with the result. Preserve slow runs so that reliability changes remain visible.
Then look at LCP and real-user measurements. A faster first byte creates an earlier opportunity to render; the browser still needs the right resources and enough main-thread time to use it.